10. Anomaly Detection
Anomaly Detection is the task of identifying samples that are abnormal / anomalous, meaning that they deviate considerably from some normal / typical data. The task is highly related to Outlier Detection and Novelty Detection. Many of the tools and techniques mentioned here can be transferred directly to those tasks.
Anomaly Detection is normally approached as an unsupervised learning problem, with the training data consisting only of normal data (potentially with a low degree of contamination). Any deviation from this normal training data is to be considered an anomaly. This is sometimes called one-class classification, as it focuses on modeling a single class (the normal class).
The one-class approach ensures that novel anomalies (different from those seen during development), are correctly classified as anomalies. If one would use a supervised binary classification, it usually has the problem that novel datapoints may be incorrectly marked as normal, because they falls inside a decision boundary in training set.
While labeled data is not used in the training set when applying unsupervised learning, in practice a small labeled dataset is critical for performance evaluation.
10.1. Applications
Anomaly Detection has wide range of applications using sensor data and embedded systems. Here are a few examples.
Area |
Task |
Sensor |
|---|---|---|
Industrial |
Condition Monitoring of rotating machninery |
Accelerometer |
Industrial |
Detecting fault in machines |
Microphone |
Electronics |
Detecting issues in Lithium Ion batteries |
Electrical/thermal |
Automotive |
Instrusion and fault detection in CANBus networks |
CANBus |
Robotics |
Monitoring executed tasks for faults |
Mix |
Health |
Detection of anomalous heartbeats |
Electrocardiogram (ECG) |
10.2. Trade-off between False Alarms and Missed Detections
Anomaly Detection involves a binary decision problem (is it an anomaly or not), has an inherent trade-off between False Alarms and Missed Detections.
Anomaly Detection models in emlearn provide a continuous anomaly score as output.
The C function has a name ending with _score()
A threshold needs to be applied, in order to convert the continuous anomaly score
to a binary decision.
10.3. Selecting anomaly threshold
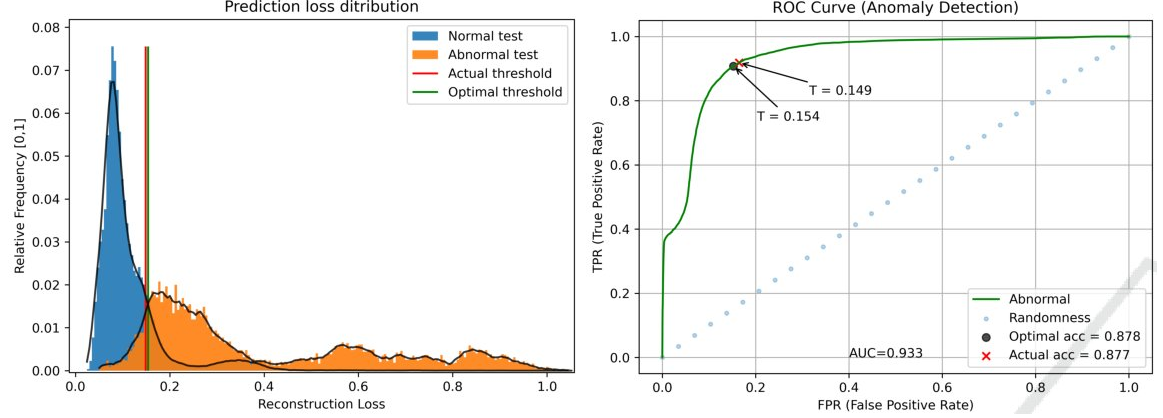
Models in scikit-learn have an automatic threshold selection, based on the hyperparameter contamination (proportion of outliers in training data). We recommend not using this mechanism, but instead analyze the continuous anomaly scores to determine an appropriate threshold. It is smart to plot the histogram over anomaly scores, with the anomaly/normal class indicated (when known).

The anomaly score histogram is very useful plot to visualize. When labels are available, it is also possible to compute a trade-off curve. Image source: “Robust Anomaly Detection in Time Series through Variational AutoEncoders and a Local Similarity Score”, Matias et.al., 2021.
The optimal way of setting the threshold, is to use a labeled validation dataset. It is then possible to pick a desired false positive vs false negative trade-off, (for example using f-score), and to determine an optimal threshold.
When the labeled data is insufficient or not present, one has to resort to other heuristics for selecting the threshold. This is often done visually, by picking a point where “most of” the “normal” data look to be included.
10.4. Anomaly Detection models
emlearn supports a selection of Anomaly Detection models.
Algorithm |
Implementation |
|---|---|
Gaussian Mixture Model (GMM) |
|
Mahalanobis distance |
A basic example of some of the models can be found in Anomaly Detection comparison.
10.5. Outlier detection for handling unknown data
Anomaly/outlier detection models are also used in Classification or Regression systems, in order to detect input data that are outside the data distribution of a trained model. Such input data can result in spurious results from the classifier/regressor. To prevent this the input data is also passed through an outlier detection model, and the outliers are marked as “unknown”.